本文實例為大家分享了Python實現k-means算法的具體代碼,供大家參考,具體內容如下
這也是周志華《機器學習》的習題9.4。
數據集是西瓜數據集4.0,如下
編號,密度,含糖率
1,0.697,0.46
2,0.774,0.376
3,0.634,0.264
4,0.608,0.318
5,0.556,0.215
6,0.403,0.237
7,0.481,0.149
8,0.437,0.211
9,0.666,0.091
10,0.243,0.267
11,0.245,0.057
12,0.343,0.099
13,0.639,0.161
14,0.657,0.198
15,0.36,0.37
16,0.593,0.042
17,0.719,0.103
18,0.359,0.188
19,0.339,0.241
20,0.282,0.257
21,0.784,0.232
22,0.714,0.346
23,0.483,0.312
24,0.478,0.437
25,0.525,0.369
26,0.751,0.489
27,0.532,0.472
28,0.473,0.376
29,0.725,0.445
30,0.446,0.459
算法很簡單,就不解釋了,代碼也不復雜,直接放上來:
# -*- coding: utf-8 -*- """Excercise 9.4"""import numpy as npimport pandas as pdimport matplotlib.pyplot as pltimport sysimport randomdata = pd.read_csv(filepath_or_buffer = '../dataset/watermelon4.0.csv', sep = ',')[["密度","含糖率"]].values########################################## K-means ####################################### k = int(sys.argv[1])#Randomly choose k samples from data as mean vectorsmean_vectors = random.sample(data,k)def dist(p1,p2): return np.sqrt(sum((p1-p2)*(p1-p2)))while True: print mean_vectors clusters = map ((lambda x:[x]), mean_vectors) for sample in data: distances = map((lambda m: dist(sample,m)), mean_vectors) min_index = distances.index(min(distances)) clusters[min_index].append(sample) new_mean_vectors = [] for c,v in zip(clusters,mean_vectors): new_mean_vector = sum(c)/len(c) #If the difference betweenthe new mean vector and the old mean vector is less than 0.0001 #then do not updata the mean vector if all(np.divide((new_mean_vector-v),v) < np.array([0.0001,0.0001]) ): new_mean_vectors.append(v) else: new_mean_vectors.append(new_mean_vector) if np.array_equal(mean_vectors,new_mean_vectors): break else: mean_vectors = new_mean_vectors #Show the clustering resulttotal_colors = ['r','y','g','b','c','m','k']colors = random.sample(total_colors,k)for cluster,color in zip(clusters,colors): density = map(lambda arr:arr[0],cluster) sugar_content = map(lambda arr:arr[1],cluster) plt.scatter(density,sugar_content,c = color)plt.show()
運行方式:在命令行輸入 python k_means.py 4。其中4就是k。
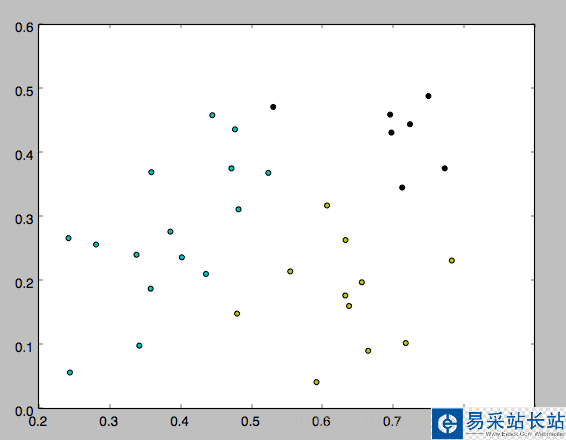
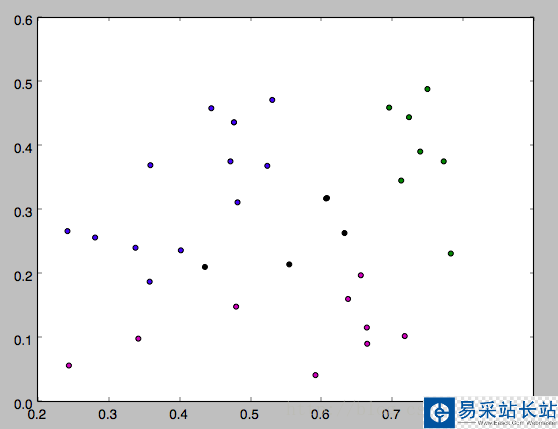
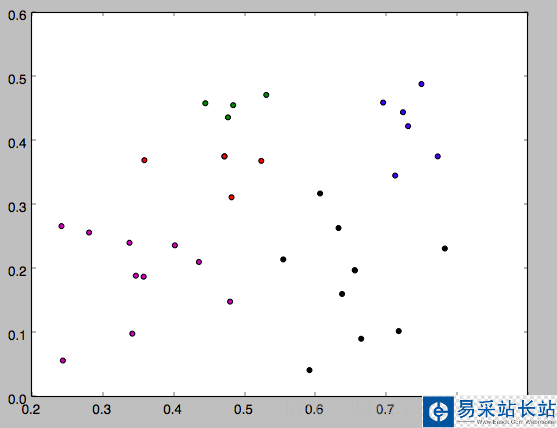
下面是k分別等于3,4,5的運行結果,因為一開始的均值向量是隨機的,所以每次運行結果會有不同。
新聞熱點


疑難解答