07:42:44 UTC - mysqld got signal 11 ; This could be because you hit a bug. It is also possible that this binary or one of the libraries it was linked against is corrupt, improperly built, or misconfigured. This error can also be caused by malfunctioning hardware. Attempting to collect some information that could help diagnose the problem. As this is a crash and something is definitely wrong, the information collection process might fail. key_buffer_size=8388608 read_buffer_size=16777216 max_used_connections=29 max_threads=5000 thread_count=32 connection_count=22 It is possible that mysqld could use up to key_buffer_size + (read_buffer_size + sort_buffer_size)*max_threads = 245834871 K bytes of memory Hope that is ok; if not, decrease some variables in the equation. Thread pointer: 0x7f607c0072c0 Attempting backtrace. You can use the following information to find out where mysqld died. If you see no messages after this, something went terribly wrong... stack_bottom = 7f6141b36e80 thread_stack 0x40000 /usr/sbin/mysqld(my_print_stacktrace+0x2c)[0xe77fec] /usr/sbin/mysqld(handle_fatal_signal+0x459)[0x7a7019] /lib/x86_64-linux-gnu/libpthread.so.0(+0xf8d0)[0x7f643257a8d0] /usr/sbin/mysqld(_ZN16Partition_helper25handle_ordered_index_scanEPh+0x5c)[0xbbabec] /usr/sbin/mysqld(_ZN7handler13ha_index_lastEPh+0x1b0)[0x7f4410] /usr/sbin/mysqld(_Z14join_read_lastP7QEP_TAB+0x65)[0xc1f605] /usr/sbin/mysqld(_Z10sub_selectP4JOINP7QEP_TABb+0x11b)[0xc25e4b] /usr/sbin/mysqld(_ZN4JOIN4execEv+0x3b8)[0xc1ea78] /usr/sbin/mysqld(_Z12handle_queryP3THDP3LEXP12Query_resultyy+0x238)[0xc8e408] /usr/sbin/mysqld[0x770ccf] /usr/sbin/mysqld(_Z21mysql_execute_commandP3THDb+0x3403)[0xc51103] /usr/sbin/mysqld(_Z11mysql_parseP3THDP12Parser_state+0x3ad)[0xc531bd] /usr/sbin/mysqld(_Z16dispatch_commandP3THDPK8COM_DATA19enum_server_command+0x817)[0xc53a47] /usr/sbin/mysqld(_Z10do_commandP3THD+0x18f)[0xc54faf] /usr/sbin/mysqld(handle_connection+0x278)[0xd108d8] /usr/sbin/mysqld(pfs_spawn_thread+0x1b4)[0xe90784] /lib/x86_64-linux-gnu/libpthread.so.0(+0x80a4)[0x7f64325730a4] /lib/x86_64-linux-gnu/libc.so.6(clone+0x6d)[0x7f6430e1b87d] Trying to get some variables. Some pointers may be invalid and cause the dump to abort. Query (7f607c015ad0): select * from test where time>='2016-07-29 00:00:00' and time<='2016-07-29 23:59:59' and tag in (2,3,6) order by id desc limit 2000 Connection ID (thread ID): 138760 Status: NOT_KILLED The manual page at http://dev.mysql.com/doc/mysql/en/crashing.html contains information that should help you find out what is causing the crash. 2016-07-29T07:42:45.661724Z mysqld_safe Number of processes running now: 0 2016-07-29T07:42:45.664516Z mysqld_safe mysqld restarted 2016-07-29T15:42:45.991109+08:00 0 [Note] /usr/sbin/mysqld (mysqld 5.7.12-log) starting as process 8367 ...
首先是第一部分的信息:
點(diǎn)擊(此處)折疊或打開
mysqld got signal 11 ; 通過perror命令(感謝@楊奇龍的場外援助..._(:з」∠)_...)看到ErrorCode的信息:
點(diǎn)擊(此處)折疊或打開
Resource temporarily unavailable 代表MySQL發(fā)現(xiàn)某一項資源臨時不可用, 應(yīng)該是資源耗盡 or 申請失敗等情況;
然后是第二部分信息:
點(diǎn)擊(此處)折疊或打開
It is possible that mysqld could use up to key_buffer_size + (read_buffer_size + sort_buffer_size)*max_threads = 245834871 K bytes of memory 這一段計算了當(dāng)前配置下, 需要的最大內(nèi)存數(shù), 大概換算了一下, 是234G;
select * from test where time>='2016-07-29 00:00:00' and time<='2016-07-29 23:59:59' and tag in (2,3,6) order by id desc limit 2000 在后來重現(xiàn)的時候, 兩次crash的語句中, 記錄的是同樣的語句, (而且堆棧的輸出信息也是完全一樣) , 僅僅只是時間不一樣:
點(diǎn)擊(此處)折疊或打開
select * from test where time>='2016-08-09 00:00:00' and time<='2016-08-09 23:59:59' and tag in (2,3,6) order by id desc limit 2000 如果是因?yàn)閮?nèi)存or系統(tǒng)資源的不可用導(dǎo)致了crash的話, 不可能有這么巧合的事情, 都是這個語句;
so, 在被拉起來的備庫上跑了一下這個語句, 結(jié)果MySQL馬上就crash了...
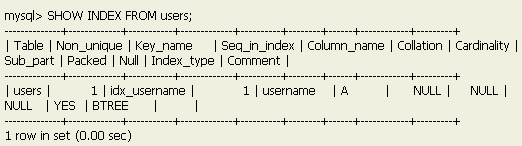
那么明顯就是這個語句的問題了, order by desc + limit, 看上去并沒什么問題, 看看explain的結(jié)果