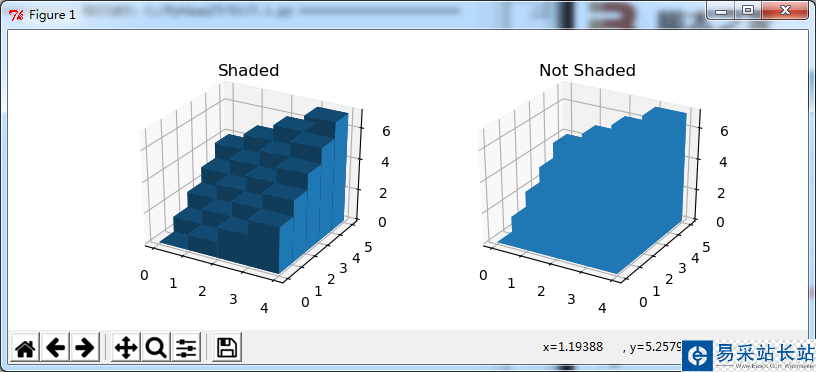
本文分享的實例主要實現的是Python+matplotlib繪制一個有陰影和沒有陰影的3D條形圖,具體如下。
首先看看演示效果:
完整代碼如下:
import numpy as npimport matplotlib.pyplot as pltfrom mpl_toolkits.mplot3d import Axes3D# setup the figure and axesfig = plt.figure(figsize=(8, 3))ax1 = fig.add_subplot(121, projection='3d')ax2 = fig.add_subplot(122, projection='3d')# fake data_x = np.arange(4)_y = np.arange(5)_xx, _yy = np.meshgrid(_x, _y)x, y = _xx.ravel(), _yy.ravel()top = x + ybottom = np.zeros_like(top)width = depth = 1ax1.bar3d(x, y, bottom, width, depth, top, shade=True)ax1.set_title('Shaded')ax2.bar3d(x, y, bottom, width, depth, top, shade=False)ax2.set_title('Not Shaded')plt.show()shade=True/False,使陰影可見/不可見。
總結
以上就是本文關于python+matplotlib繪制3D條形圖實例代碼的全部內容,希望對大家有所幫助。感興趣的朋友可以繼續參閱本站其他相關專題,如有不足之處,歡迎留言指出。感謝朋友們對本站的支持!
新聞熱點


疑難解答