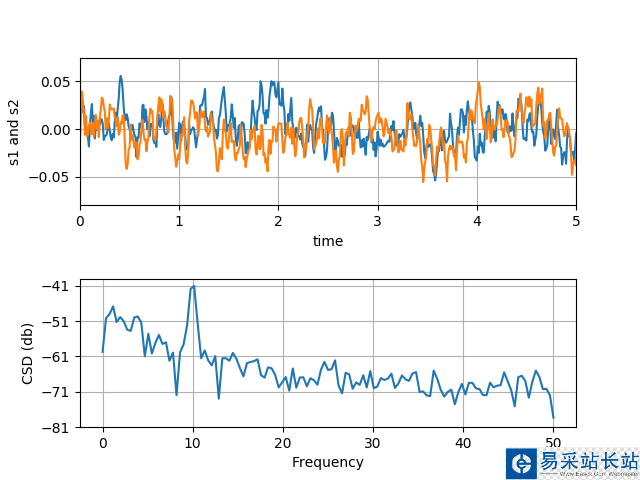
計算兩個信號的交叉譜密度
結果展示:
完整代碼:
import numpy as npimport matplotlib.pyplot as pltfig, (ax1, ax2) = plt.subplots(2, 1)# make a little extra space between the subplotsfig.subplots_adjust(hspace=0.5)dt = 0.01t = np.arange(0, 30, dt)# Fixing random state for reproducibilitynp.random.seed(19680801)nse1 = np.random.randn(len(t)) # white noise 1nse2 = np.random.randn(len(t)) # white noise 2r = np.exp(-t / 0.05)cnse1 = np.convolve(nse1, r, mode='same') * dt # colored noise 1cnse2 = np.convolve(nse2, r, mode='same') * dt # colored noise 2# two signals with a coherent part and a random parts1 = 0.01 * np.sin(2 * np.pi * 10 * t) + cnse1s2 = 0.01 * np.sin(2 * np.pi * 10 * t) + cnse2ax1.plot(t, s1, t, s2)ax1.set_xlim(0, 5)ax1.set_xlabel('time')ax1.set_ylabel('s1 and s2')ax1.grid(True)cxy, f = ax2.csd(s1, s2, 256, 1. / dt)ax2.set_ylabel('CSD (db)')plt.show()總結
以上就是本文關于Python+matplotlib實現計算兩個信號的交叉譜密度實例的全部內容,希望對大家有所幫助。感興趣的朋友可以繼續參閱本站其他相關專題,如有不足之處,歡迎留言指出。感謝朋友們對本站的支持!
新聞熱點


疑難解答