1.首先要繪制一個簡單的條形圖
import numpy as npimport matplotlib.pyplot as pltfrom matplotlib import mlabfrom matplotlib import rcParamsfig1 = plt.figure(2)rects =plt.bar(left = (0.2,1),height = (1,0.5),width = 0.2,align="center",yerr=0.000001)plt.title('Pe')plt.show()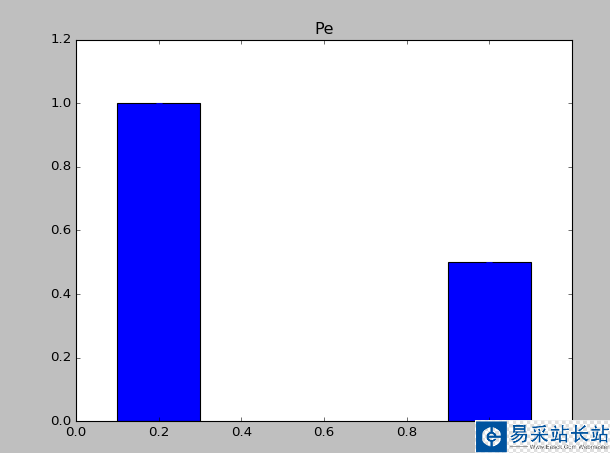
1.1上面中rects=plt.bar(left=(0.2,1),height=(1,0.5),width=0.2,align=”center”,yerr=0.000001)這句代碼是最重要的,其中l(wèi)eft表示直方圖的開始的位置(也就是最左邊的地方),height是指直方圖的高度,當(dāng)直方圖太粗時,可以通過width來定義直方圖的寬度,注意多個直方圖要用元組,yerr這個參數(shù)是防止直方圖觸頂。
2.增加直方圖腳注
import numpy as npimport matplotlib.pyplot as pltfrom matplotlib import mlabfrom matplotlib import rcParamsfig1 = plt.figure(2)rects =plt.bar(left = (0.2,1),height = (1,0.5),width = 0.2,align="center",yerr=0.000001)plt.title('Pe')plt.xticks((0.2,1),('frst','second'))plt.show()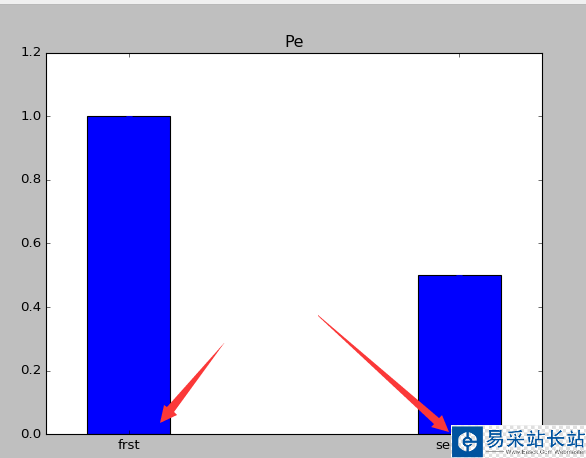
3.條形圖上顯示具體的數(shù)字(自動編號)
import numpy as npimport matplotlib.pyplot as pltfrom matplotlib import mlabfrom matplotlib import rcParamsfig1 = plt.figure(2)rects =plt.bar(left = (0.2,1),height = (1,0.5),width = 0.2,align="center",yerr=0.000001)plt.title('Pe')def autolabel(rects): for rect in rects: height = rect.get_height() plt.text(rect.get_x()+rect.get_width()/2., 1.03*height, '%s' % float(height))autolabel(rects)plt.xticks((0.2,1),('frst','second'))plt.show()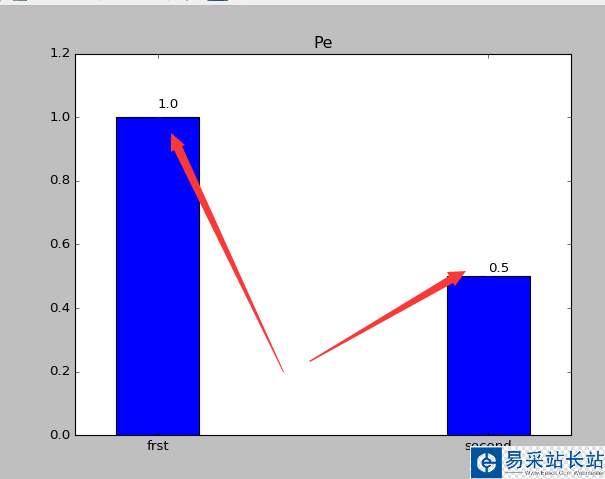
4.改變顏色
import numpy as npimport matplotlib.pyplot as pltfrom matplotlib import mlabfrom matplotlib import rcParamsfig1 = plt.figure(2)rects =plt.bar(left = (0.2,1),height = (1,0.5),color=('r','g'),width = 0.2,align="center",yerr=0.000001)plt.title('Pe')def autolabel(rects): for rect in rects: height = rect.get_height() plt.text(rect.get_x()+rect.get_width()/2., 1.03*height, '%s' % float(height))autolabel(rects)plt.xticks((0.2,1),('frst','second'))plt.show()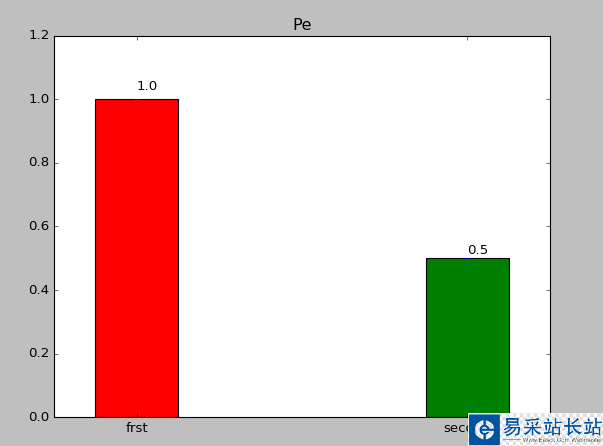
5.添加圖注
import numpy as npimport matplotlib.pyplot as pltfrom matplotlib import mlabfrom matplotlib import rcParamsfig1 = plt.figure(2)rects1 =plt.bar(left = (0.2),height = (0.5),color=('g'),label=(('no1')),width = 0.2,align="center",yerr=0.000001)rects2 =plt.bar(left = (1),height = (1),color=('r'),label=(('no2')),width = 0.2,align="center",yerr=0.000001)plt.legend()plt.xticks((0.2,1),('frst','second'))plt.title('Pe')def autolabel(rects): for rect in rects: height = rect.get_height() plt.text(rect.get_x()+rect.get_width()/2., 1.03*height, '%s' % float(height))autolabel(rects1)autolabel(rects2)plt.show()
新聞熱點(diǎn)


疑難解答
圖片精選