pygal的安裝大家可以參閱:pip和pygal的安裝實例教程
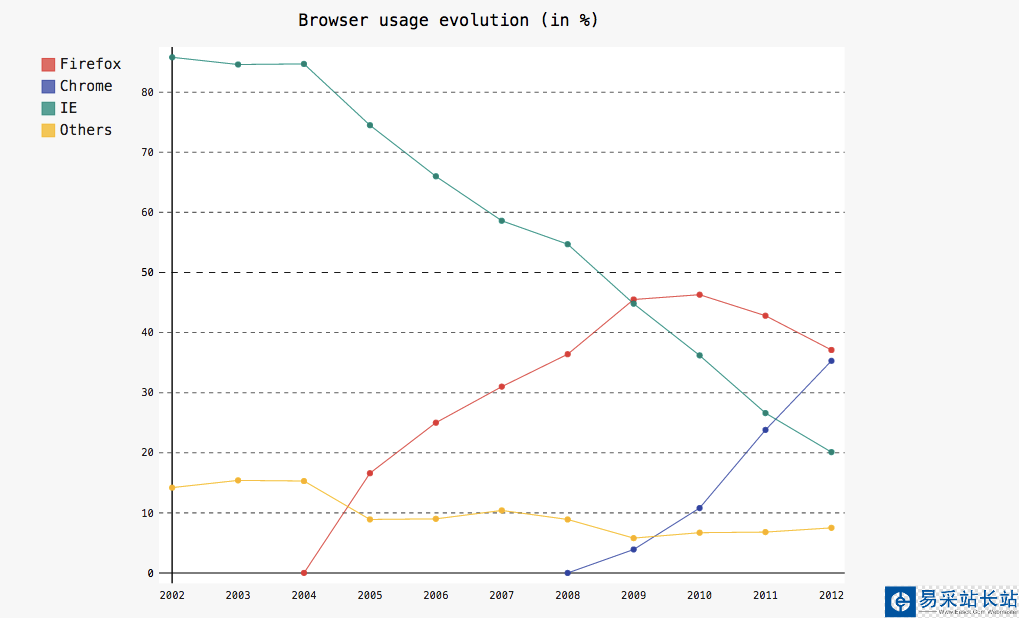
線圖:
import pygalline_chart = pygal.Line()line_chart.title = 'Browser usage evolution (in %)'line_chart.x_labels = map(str, range(2002, 2013))line_chart.add('Firefox', [None, None, 0, 16.6, 25, 31, 36.4, 45.5, 46.3, 42.8, 37.1])line_chart.add('Chrome', [None, None, None, None, None, None, 0, 3.9, 10.8, 23.8, 35.3])line_chart.add('IE', [85.8, 84.6, 84.7, 74.5, 66, 58.6, 54.7, 44.8, 36.2, 26.6, 20.1])line_chart.add('Others', [14.2, 15.4, 15.3, 8.9, 9, 10.4, 8.9, 5.8, 6.7, 6.8, 7.5])line_chart.render_to_file('bar_chart.svg')
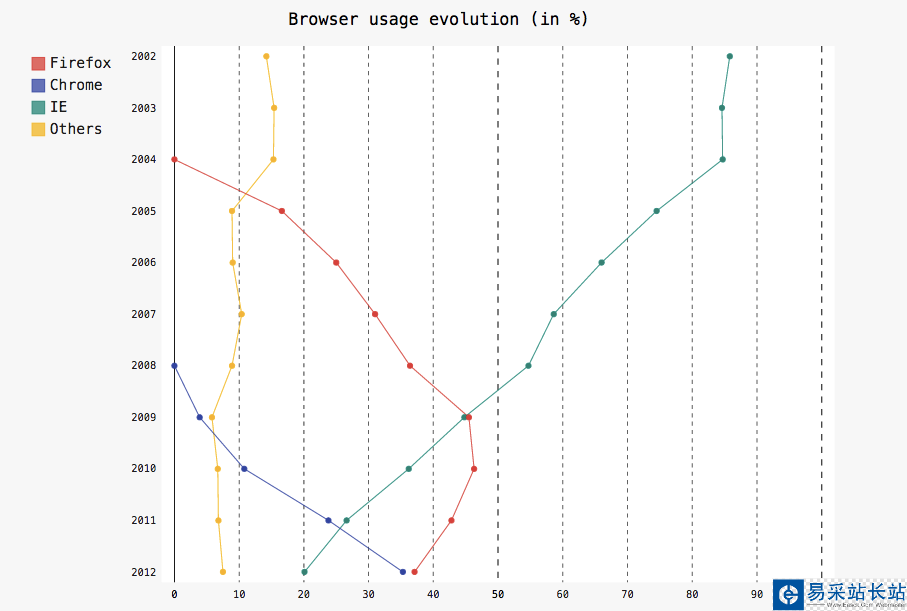
水平線圖:
line_chart = pygal.HorizontalLine()line_chart.title = 'Browser usage evolution (in %)'line_chart.x_labels = map(str, range(2002, 2013))line_chart.add('Firefox', [None, None, 0, 16.6, 25, 31, 36.4, 45.5, 46.3, 42.8, 37.1])line_chart.add('Chrome', [None, None, None, None, None, None, 0, 3.9, 10.8, 23.8, 35.3])line_chart.add('IE', [85.8, 84.6, 84.7, 74.5, 66, 58.6, 54.7, 44.8, 36.2, 26.6, 20.1])line_chart.add('Others', [14.2, 15.4, 15.3, 8.9, 9, 10.4, 8.9, 5.8, 6.7, 6.8, 7.5])line_chart.range = [0, 100]line_chart.render_to_file('bar_chart.svg')
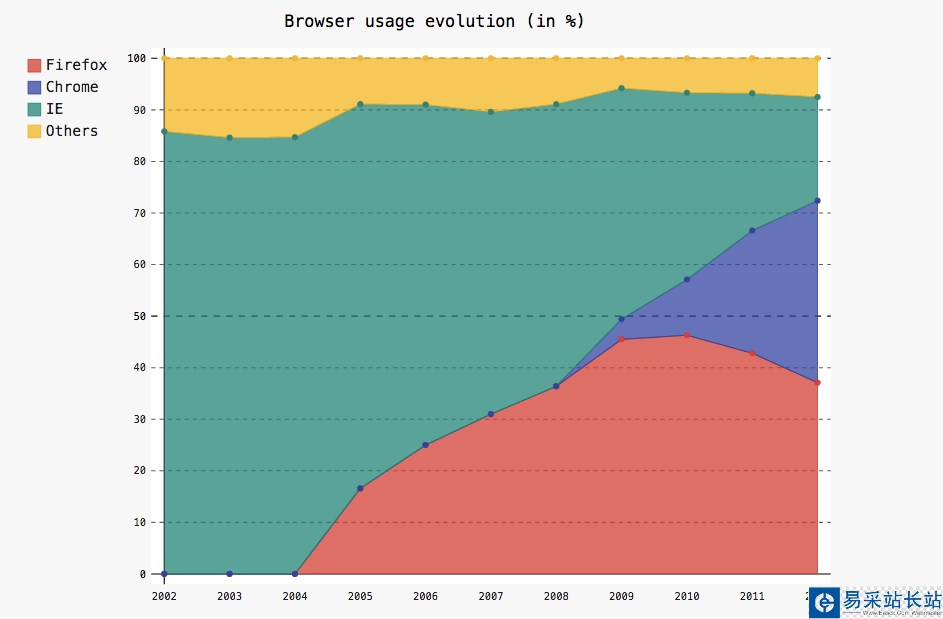
疊加測線:
line_chart = pygal.StackedLine(fill=True)line_chart.title = 'Browser usage evolution (in %)'line_chart.x_labels = map(str, range(2002, 2013))line_chart.add('Firefox', [None, None, 0, 16.6, 25, 31, 36.4, 45.5, 46.3, 42.8, 37.1])line_chart.add('Chrome', [None, None, None, None, None, None, 0, 3.9, 10.8, 23.8, 35.3])line_chart.add('IE', [85.8, 84.6, 84.7, 74.5, 66, 58.6, 54.7, 44.8, 36.2, 26.6, 20.1])line_chart.add('Others', [14.2, 15.4, 15.3, 8.9, 9, 10.4, 8.9, 5.8, 6.7, 6.8, 7.5])line_chart.render_to_file('bar_chart.svg')
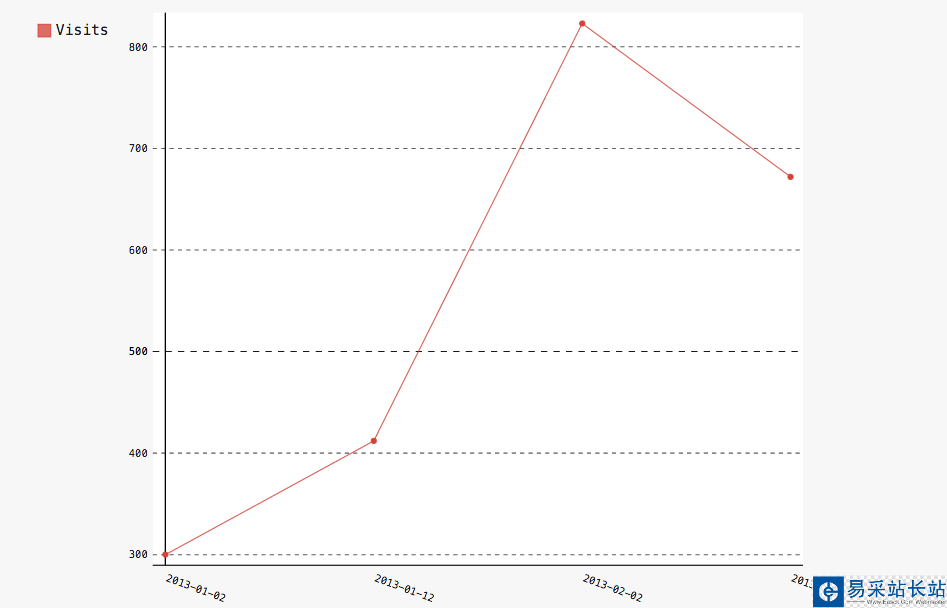
對于時間相關的圖,只需格式化標簽或使用xy圖表的一個變體:
from datetime import datetimedate_chart = pygal.Line(x_label_rotation=20)date_chart.x_labels = map(lambda d: d.strftime('%Y-%m-%d'), [ datetime(2013, 1, 2), datetime(2013, 1, 12), datetime(2013, 2, 2), datetime(2013, 2, 22)])date_chart.add("Visits", [300, 412, 823, 672])date_chart.render_to_file('bar_chart.svg')
總結
以上就是本文關于Python學習pygal繪制線圖代碼分享的全部內容,希望對大家有所幫助。感興趣的朋友可以繼續參閱本站其他相關專題。如有不足之處,歡迎留言指出。感謝朋友們對本站的支持!
|
新聞熱點
疑難解答