通過本篇內容給大家介紹一下Python實現金融數據可視化中兩列數據的提取、分別畫、雙坐標軸、雙圖、兩種不同的圖等代碼寫法和思路總結。
import matplotlib as mplimport numpy as npimport matplotlib.pyplot as pltnp.random.seed(2000)y = np.random.standard_normal((20,2))# print(y)'''不同的求和print(y.cumsum())print(y.sum(axis=0))print(y.cumsum(axis=0))'''# 繪圖plt.figure(figsize=(7,4))plt.plot(y.cumsum(axis=0),linewidth=2.5)plt.plot(y.cumsum(axis=0),'bo')plt.grid(True)plt.axis("tight")plt.xlabel('index')plt.ylabel('values')plt.title('a simple plot')plt.show()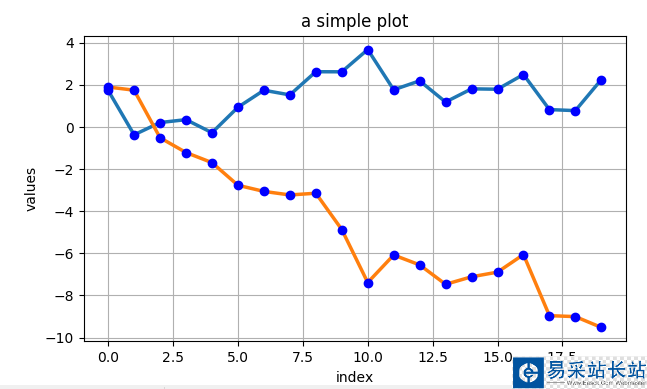
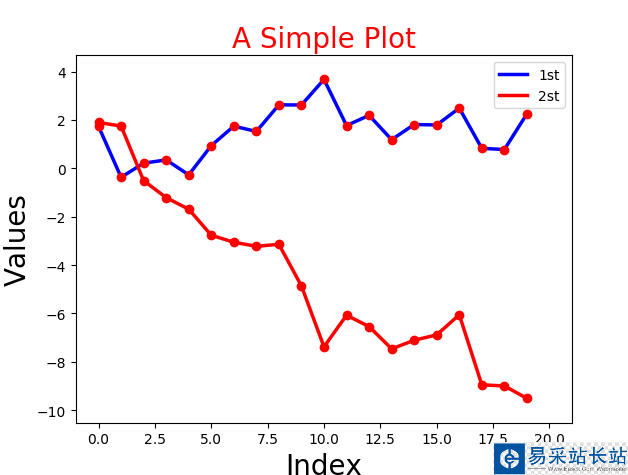
2.下面分別提取兩組數據,進行繪圖。
import matplotlib as mplimport numpy as npimport matplotlib.pyplot as pltnp.random.seed(2000)date = np.random.standard_normal((20,2))y = date.cumsum(axis=0)print(y)# 重點下面兩種情況的區別print(y[1]) # 取得是 第1行的數據 [-0.37003581 1.74900181]print(y[:,0]) # 取得是 第1列的數據 [ 1.73673761 -0.37003581 0.21302575 0.35026529 ...# 繪圖plt.plot(y[:,0],lw=2.5,label="1st",color='blue')plt.plot(y[:,1],lw=2.5,label="2st",color='red')plt.plot(y,'ro')# 添加細節plt.title("A Simple Plot",size=20,color='red')plt.xlabel('Index',size=20)plt.ylabel('Values',size=20)# plt.axis('tight')plt.xlim(-1,21)plt.ylim(np.min(y)-1,np.max(y)+1)# 添加圖例plt.legend(loc=0)plt.show()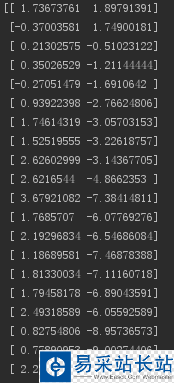
3.雙坐標軸。
import matplotlib as mplimport numpy as npimport matplotlib.pyplot as pltnp.random.seed(2000)date = np.random.standard_normal((20,2))y = date.cumsum(axis=0)y[:,0]=y[:,0]*100fig,ax1 = plt.subplots()plt.plot(y[:,0],'b',label="1st")plt.plot(y[:,0],'ro')plt.grid(True)plt.axis('tight')plt.xlabel("Index")plt.ylabel('Values of 1st')plt.title("This is double axis label")plt.legend(loc=0)ax2=ax1.twinx()plt.plot(y[:,1],'g',label="2st")plt.plot(y[:,1],'r*')plt.ylabel("Values of 2st")plt.legend(loc=0)plt.show()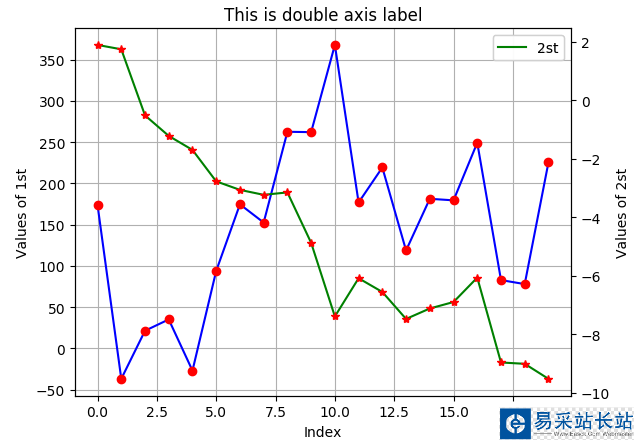
4. 分為兩個圖繪畫。
import matplotlib as mplimport numpy as npimport matplotlib.pyplot as pltnp.random.seed(2000)date = np.random.standard_normal((20,2))y = date.cumsum(axis=0)y[:,0]=y[:,0]*100plt.figure(figsize=(7,5)) # 確定圖片大小plt.subplot(211) # 確定第一個圖的位置 (行,列,第幾個)兩行一列第一個圖plt.plot(y[:,0],'b',label="1st")plt.plot(y[:,0],'ro')plt.grid(True)plt.axis('tight')plt.xlabel("Index")plt.ylabel('Values of 1st')plt.title("This is double axis label")plt.legend(loc=0)plt.subplot(212) # 確定第一個圖的位置plt.plot(y[:,1],'g',label="2st")plt.plot(y[:,1],'r*')plt.ylabel("Values of 2st")plt.legend(loc=0)plt.show()
新聞熱點


疑難解答