案例:該數據集的是一個關于每個學生成績的數據集,接下來我們對該數據集進行分析,判斷學生是否適合繼續深造
數據集特征展示
1 GRE 成績 (290 to 340)2 TOEFL 成績(92 to 120)3 學校等級 (1 to 5)4 自身的意愿 (1 to 5)5 推薦信的力度 (1 to 5)6 CGPA成績 (6.8 to 9.92)7 是否有研習經驗 (0 or 1)8 讀碩士的意向 (0.34 to 0.97)
1.導入包
import numpy as npimport pandas as pdimport matplotlib.pyplot as pltimport seaborn as snsimport os,sys
2.導入并查看數據集
df = pd.read_csv("D://machine-learning//score//Admission_Predict.csv",sep = ",")
print('There are ',len(df.columns),'columns')
for c in df.columns:
 sys.stdout.write(str(c)+', '
There are 9 columnsSerial No., GRE Score, TOEFL Score, University Rating, SOP, LOR , CGPA, Research, Chance of Admit ,
一共有9列特征
df.info()
<class 'pandas.core.frame.DataFrame'>RangeIndex: 400 entries, 0 to 399Data columns (total 9 columns):Serial No.   400 non-null int64GRE Score   400 non-null int64TOEFL Score   400 non-null int64University Rating 400 non-null int64SOP     400 non-null float64LOR     400 non-null float64CGPA     400 non-null float64Research    400 non-null int64Chance of Admit  400 non-null float64dtypes: float64(4), int64(5)memory usage: 28.2 KB

數據集信息:
1.數據有9個特征,分別是學號,GRE分數,托福分數,學校等級,SOP,LOR,CGPA,是否參加研習,進修的幾率
2.數據集中沒有空值
3.一共有400條數據
# 整理列名稱df = df.rename(columns={'Chance of Admit ':'Chance of Admit'})
# 顯示前5列數據
df.head()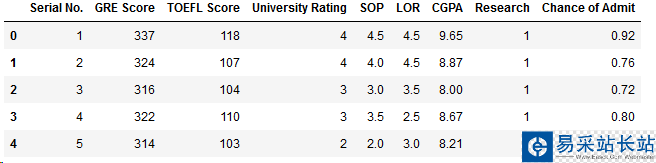
3.查看每個特征的相關性
fig,ax = plt.subplots(figsize=(10,10))sns.heatmap(df.corr(),ax=ax,annot=True,linewidths=0.05,fmt='.2f',cmap='magma')plt.show()
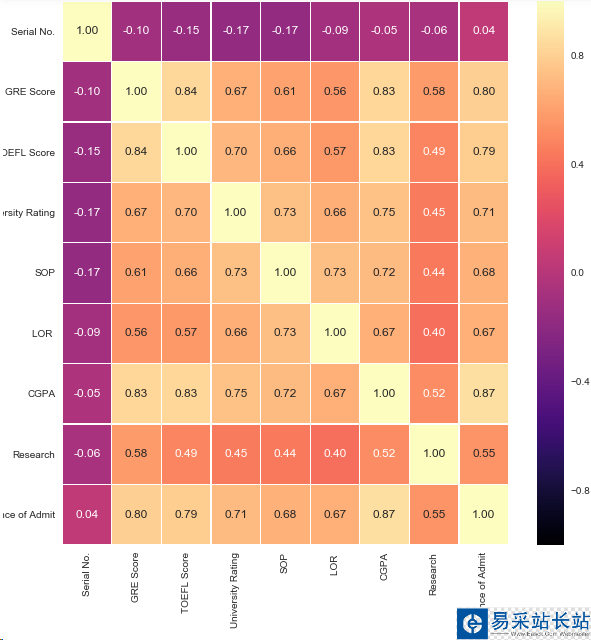
結論:1.最有可能影響是否讀碩士的特征是GRE,CGPA,TOEFL成績
2.影響相對較小的特征是LOR,SOP,和Research
4.數據可視化,雙變量分析
4.1 進行Research的人數
print("Not Having Research:",len(df[df.Research == 0]))print("Having Research:",len(df[df.Research == 1]))y = np.array([len(df[df.Research == 0]),len(df[df.Research == 1])])x = np.arange(2)plt.bar(x,y)plt.title("Research Experience")plt.xlabel("Canditates")plt.ylabel("Frequency")plt.xticks(x,('Not having research','Having research'))plt.show()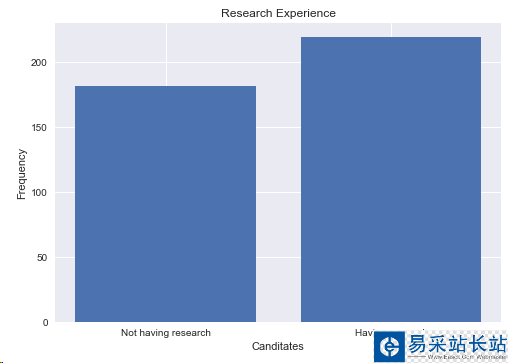
結論:進行research的人數是219,本科沒有research人數是181
新聞熱點


疑難解答