網上下載mayavi的官方幫助文檔,里面有很多例子,下面的記錄都是查看手冊后得到的。
http://code.enthought.com/projects/mayavi/docs/development/latex/mayavi/mayavi_user_guide.pdf
python的mayavi.mlab庫中的繪圖函數有很多候選參數,但下文記錄并沒有過多討論,本人也是需要用到才查看手冊的。
安裝好mayavi2的繪圖環境后,可以結合numpy進行科學繪圖,在代碼中事先加入如下代碼:
import mayavi.mlab as mlab from numpy import exp,sin,cos,tan,random,mgrid,ogrid,linspace,sqrt,pi import numpy as np import matplotlib.pyplot as plt mlab.figure(fgcolor=(0, 0, 0), bgcolor=(1, 1, 1)) #更改背景色 #添加matlab的peaks函數 def peaks(x,y): return 3.0*(1.0-x)**2*exp(-(x**2) - (y+1.0)**2) - 10*(x/5.0 - x**3 - y**5) * exp(-x**2-y**2) - 1.0/3.0*exp(-(x+1.0)**2 - y**2)
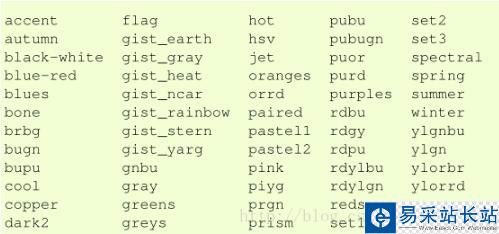
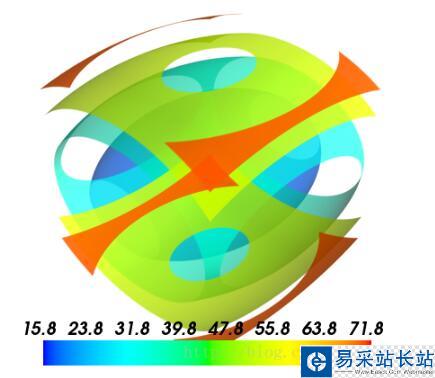
首先從幫助手冊上了解下mayavi的colormap,如下圖:
下面列舉常用的三維繪圖函數和簡單例子。
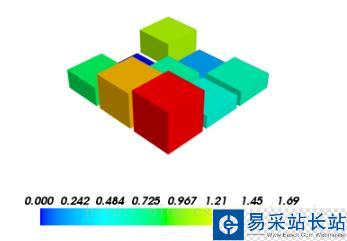
一、barchart
* barchart(s, ...)
* barchart(x, y, s, ...)
* barchart(x, y, f, ...)
* barchart(x, y, z, s, ...)
* barchart(x, y, z, f, ...)
如果只傳遞一個參數,可以是一維(1-D),二維(2-D)或3維(3-D)的給定向量長度的數組;
如果傳遞三個參數(x,y,s)或(x,y,f),x,y是對應于數組s的二維(2-D)坐標,也可以是可調用的函數f,該函數返回數組;
四個參數的時候(x,y,z)表示三維坐標
s = np.random.rand(3,3) mlab.barchart(s) mlab.vectorbar() mlab.show()
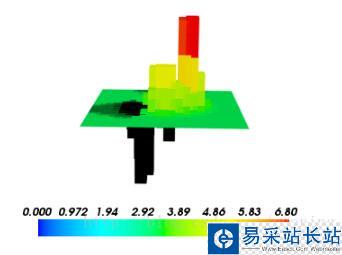
x,y = np.mgrid[-5:5:20j,-5:5:20j] s = peaks(x,y) #peaks函數前面已經定義 mlab.barchart(x,y,s) mlab.vectorbar() mlab.show()
二、contour3d
* contour3d(scalars, ...)
* contour3d(x, y, z, scalars, ...)
* contour3d(x, y, z, f, ...)
scalars是三維數組(3-D),x,y,z用numpy.mgrid生成,是三維數組
x, y, z = ogrid[-5:5:64j, -5:5:64j, -5:5:64j] scalars = x * x * 0.5 + y * y + z * z * 2.0 mlab.contour3d(scalars, contours=6, transparent=True) mlab.colorbar() mlab.show()
三、contour_surf
* contour_surf(s, ...)
* contour_surf(x, y, s, ...)
* contour_surf(x, y, f, ...)
s是二維數組,f是可調用的函數,例如peaks函數
x and y can be 1D or 2D arrays (such as returned by numpy.ogrid or numpy.mgrid)
新聞熱點


疑難解答