本文實例為大家分享了python實現三次樣條插值的具體代碼,供大家參考,具體內容如下
函數:
算法分析
三次樣條插值。就是在分段插值的一種情況。
要求:
這里話,根據第一類樣條作為邊界。(就是知道兩端節點的導數數值,然后來做三次樣條插值)
但是這里也分為兩種情況,分別是這個數值是隨便給的一個數,還是說根據函數的在對應點上數值給出。
情況一:兩邊導數數值給出
這里假設數值均為1。即 f′(x0)=f′(xn)=f′(xn)=1的情況。
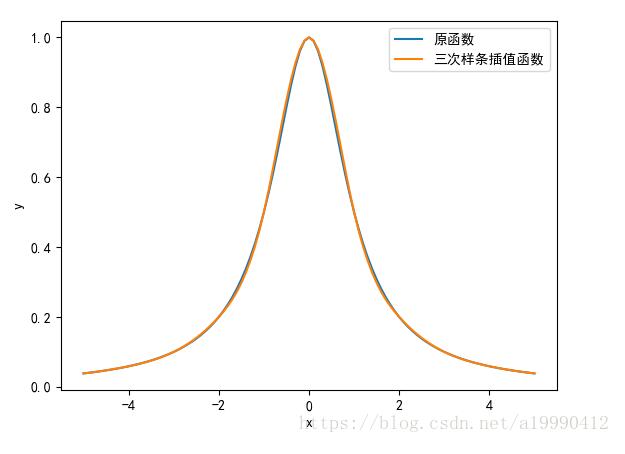
情況一圖像

情況一代碼
import numpy as npfrom sympy import *import matplotlib.pyplot as pltdef f(x): return 1 / (1 + x ** 2)def cal(begin, end, i): by = f(begin) ey = f(end) I = Ms[i] * ((end - n) ** 3) / 6 + Ms[i + 1] * ((n - begin) ** 3) / 6 + (by - Ms[i] / 6) * (end - n) + ( ey - Ms[i + 1] / 6) * (n - begin) return Idef ff(x): # f[x0, x1, ..., xk] ans = 0 for i in range(len(x)): temp = 1 for j in range(len(x)): if i != j: temp *= (x[i] - x[j]) ans += f(x[i]) / temp return ansdef calM(): lam = [1] + [1 / 2] * 9 miu = [1 / 2] * 9 + [1] # Y = 1 / (1 + n ** 2) # df = diff(Y, n) x = np.array(range(11)) - 5 # ds = [6 * (ff(x[0:2]) - df.subs(n, x[0]))] ds = [6 * (ff(x[0:2]) - 1)] for i in range(9): ds.append(6 * ff(x[i: i + 3])) # ds.append(6 * (df.subs(n, x[10]) - ff(x[-2:]))) ds.append(6 * (1 - ff(x[-2:]))) Mat = np.eye(11, 11) * 2 for i in range(11): if i == 0: Mat[i][1] = lam[i] elif i == 10: Mat[i][9] = miu[i - 1] else: Mat[i][i - 1] = miu[i - 1] Mat[i][i + 1] = lam[i] ds = np.mat(ds) Mat = np.mat(Mat) Ms = ds * Mat.I return Ms.tolist()[0]def calnf(x): nf = [] for i in range(len(x) - 1): nf.append(cal(x[i], x[i + 1], i)) return nfdef calf(f, x): y = [] for i in x: y.append(f.subs(n, i)) return ydef nfSub(x, nf): tempx = np.array(range(11)) - 5 dx = [] for i in range(10): labelx = [] for j in range(len(x)): if x[j] >= tempx[i] and x[j] < tempx[i + 1]: labelx.append(x[j]) elif i == 9 and x[j] >= tempx[i] and x[j] <= tempx[i + 1]: labelx.append(x[j]) dx = dx + calf(nf[i], labelx) return np.array(dx)def draw(nf): plt.rcParams['font.sans-serif'] = ['SimHei'] plt.rcParams['axes.unicode_minus'] = False x = np.linspace(-5, 5, 101) y = f(x) Ly = nfSub(x, nf) plt.plot(x, y, label='原函數') plt.plot(x, Ly, label='三次樣條插值函數') plt.xlabel('x') plt.ylabel('y') plt.legend() plt.savefig('1.png') plt.show()def lossCal(nf): x = np.linspace(-5, 5, 101) y = f(x) Ly = nfSub(x, nf) Ly = np.array(Ly) temp = Ly - y temp = abs(temp) print(temp.mean())if __name__ == '__main__': x = np.array(range(11)) - 5 y = f(x) n, m = symbols('n m') init_printing(use_unicode=True) Ms = calM() nf = calnf(x) draw(nf) lossCal(nf)情況二:兩邊導數數值由函數本身算出
這里假設數值均為1。即 f′(xi)=S′(xi)(i=0,n)f′(xi)=S′(xi)(i=0,n)的情況。
情況二圖像

情況二代碼
import numpy as npfrom sympy import *import matplotlib.pyplot as pltdef f(x): return 1 / (1 + x ** 2)def cal(begin, end, i): by = f(begin) ey = f(end) I = Ms[i] * ((end - n) ** 3) / 6 + Ms[i + 1] * ((n - begin) ** 3) / 6 + (by - Ms[i] / 6) * (end - n) + ( ey - Ms[i + 1] / 6) * (n - begin) return Idef ff(x): # f[x0, x1, ..., xk] ans = 0 for i in range(len(x)): temp = 1 for j in range(len(x)): if i != j: temp *= (x[i] - x[j]) ans += f(x[i]) / temp return ansdef calM(): lam = [1] + [1 / 2] * 9 miu = [1 / 2] * 9 + [1] Y = 1 / (1 + n ** 2) df = diff(Y, n) x = np.array(range(11)) - 5 ds = [6 * (ff(x[0:2]) - df.subs(n, x[0]))] # ds = [6 * (ff(x[0:2]) - 1)] for i in range(9): ds.append(6 * ff(x[i: i + 3])) ds.append(6 * (df.subs(n, x[10]) - ff(x[-2:]))) # ds.append(6 * (1 - ff(x[-2:]))) Mat = np.eye(11, 11) * 2 for i in range(11): if i == 0: Mat[i][1] = lam[i] elif i == 10: Mat[i][9] = miu[i - 1] else: Mat[i][i - 1] = miu[i - 1] Mat[i][i + 1] = lam[i] ds = np.mat(ds) Mat = np.mat(Mat) Ms = ds * Mat.I return Ms.tolist()[0]def calnf(x): nf = [] for i in range(len(x) - 1): nf.append(cal(x[i], x[i + 1], i)) return nfdef calf(f, x): y = [] for i in x: y.append(f.subs(n, i)) return ydef nfSub(x, nf): tempx = np.array(range(11)) - 5 dx = [] for i in range(10): labelx = [] for j in range(len(x)): if x[j] >= tempx[i] and x[j] < tempx[i + 1]: labelx.append(x[j]) elif i == 9 and x[j] >= tempx[i] and x[j] <= tempx[i + 1]: labelx.append(x[j]) dx = dx + calf(nf[i], labelx) return np.array(dx)def draw(nf): plt.rcParams['font.sans-serif'] = ['SimHei'] plt.rcParams['axes.unicode_minus'] = False x = np.linspace(-5, 5, 101) y = f(x) Ly = nfSub(x, nf) plt.plot(x, y, label='原函數') plt.plot(x, Ly, label='三次樣條插值函數') plt.xlabel('x') plt.ylabel('y') plt.legend() plt.savefig('1.png') plt.show()def lossCal(nf): x = np.linspace(-5, 5, 101) y = f(x) Ly = nfSub(x, nf) Ly = np.array(Ly) temp = Ly - y temp = abs(temp) print(temp.mean())if __name__ == '__main__': x = np.array(range(11)) - 5 y = f(x) n, m = symbols('n m') init_printing(use_unicode=True) Ms = calM() nf = calnf(x) draw(nf) lossCal(nf)以上就是本文的全部內容,希望對大家的學習有所幫助,也希望大家多多支持VEVB武林網。
新聞熱點
疑難解答